Real-time scoreboard for dealerships & dealer groups

One deal logged.Every dashboard current.

A finance manager enters the deal in about a minute — customer, stock number, front gross, each F&I product and its profit, lender. From that one entry the salesperson sees their deals, their ranking, their pay and their schedule. The desk, the F&I team and the GM each see grosses, rankings, PVR, units, schedules and goals — on their own phones or desktops.

Free30-day dealership trial
1 minuteTo log a deal
DirectFounder support
thedasboard.com/dashboard
Live
Units14/20
Gross$32.4k
Pay MTD$4,120
Monthly goal70%
Rank on the board3 of 12
Last deal logged11 min ago

Every role sees the same deals, cut the way that role is measured. Nothing here is typed twice.

Works with the DMS you already run. The DAS Board sits on top of it and complements it. It never replaces the DMS, and it never desks or funds a deal.

CDKReynolds & ReynoldsDealertrack

What the board actually shows

People manage the number they can see.

Every readout below is built from deals the store logged that month — not an import, not a spreadsheet somebody maintains on the side.

Pay to date · salesperson

Month to date$4,120
Front end · 25%$1,860
Back end · 5%$1,910
Spiffs & bonuses$350

Pay plans are configured per store, and the app runs that plan against the real deals. Visible on the 20th — not disputed after payroll.

Pace · monthly goal

14 / 20 unitsOn pace
70% of goal9 selling days left

Goals and pacing for the individual, the team and the store — one piece of arithmetic, and every role is measured on it.

Who's Up · floor rotation

1Sarah J.Up now
2Michael C.Be-back
3David R.

Showroom traffic and the up rotation, with be-backs flagged as they walk in.

Factory money · GM view

6

more units to the next OEM tier

The store sees the gap to the next tier while there is still month left to close it.

Product penetration · F&I

VSC68%
GAP61%
PPM45%

Per product, per manager, per month — with PVR and products per deal beside it.

Split deal · credited automatically

Sarah Johnson 0.5 units
50 / 50
David Rodriguez 0.5 units

A split is entered once and credits both people — units, gross and pay — so the board and the payroll agree.

Example figures.

One entry, every point of view

Each role gets the board that role is judged on.

Salesperson
Own units and gross, pace against the monthly goal, rank on the board, and what the month's deals pay under the store's plan.
Finance Manager
Deal log, PVR, products per deal, penetration by product, and the F&I leaderboard.
Sales Manager
Team board, the Who's Up floor rotation, goals, schedules with approval, and the pay tracker.
Finance Director
Department oversight and per-manager comparison across the whole F&I team.
General Manager
Whole-store gross and units, department pacing, and how many more units reach the next factory money tier.
Group & AVP
Every rooftop side by side, on the same definitions, in one view.
Everyone
Spiffs and bonuses, CSI, schedules, showroom traffic and be-backs. Ten languages, seven currencies. An advisor answers a fixed set of questions from the store's own numbers.

Free demo

See The DAS Board in action.

Get a demo code and open the live dashboards on a seeded dealership. Every role, real screens, read-only.

  • Open the product itself — the same build a paying store logs in to
  • Switch between salesperson, F&I, the desk and the GM and read each board
  • See what a month of deals pays under a configured pay plan
  • No call and no calendar: the code arrives and you are in
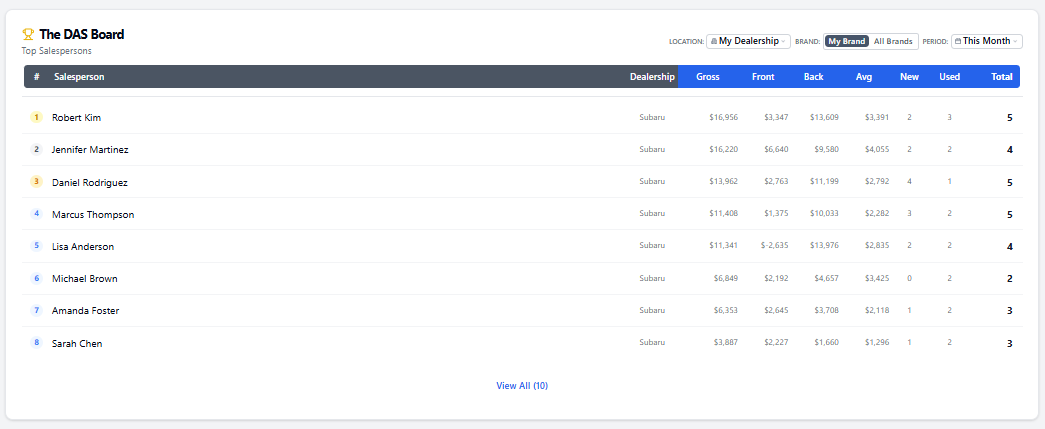
A slice of the salesperson dashboard: the leaderboard, with each rep's gross, front, back, average and units.© The DAS Board — proprietary dashboard interface. Contact for licensing.
Salesperson · the board
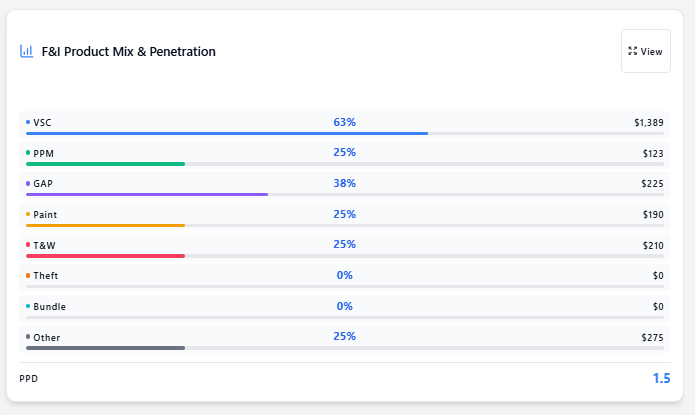
A slice of the finance manager dashboard: product mix with penetration bars for the service contract, prepaid maintenance and GAP.© The DAS Board — proprietary dashboard interface. Contact for licensing.
Finance manager · product mix

Two cropped slices of the real product. The full dashboards open in the demo.

Who built it

“The person whose pay depends on the number is the last one to see it.”

Dan Caplan · Founder

Twenty-seven years in dealerships, and still working the floor as a finance manager today. The DAS Board was built from the desk rather than from a whiteboard — which is why a deal takes a minute to log, and why the pay math is the store's real plan instead of a generic formula.

Support comes from the same person who built it.

Pricing

Two ways in.

One F&I manager tracking their own book, or the whole store with every role on it.

Single Finance Manager

$5per month

For one F&I manager tracking their own deals, independent of whatever the store has set up.

  • Your own deal log, entered in about a minute
  • PVR, products per deal and penetration
  • Your pay, calculated from your pay plan
  • Runs alongside whatever the store already uses

14-day free trial

Dealership — every role on the store

$100per store, per monthLaunch pricingSpecial pricing while we launch — start your trial now and lock it in.

Launch pricing: a flat $100 per dealership, per month, for stores that sign up now. The base includes 10 salespeople, 2 finance managers and 2 desk managers; add-on team bundles start at $50 a month for bigger stores.

  • A dashboard for every role on the store
  • Pay plans configured per store and run against real deals
  • Goals and pacing, schedules with approval, spiffs and bonuses
  • CSI, showroom traffic and be-back tracking
  • Ten languages, seven currencies
  • Support direct from the founder

30-day free trial

Dealer groups pay the same launch price of $100 per rooftop, with the group and AVP views included.

Open the real dashboards, on a real store's numbers.

A demo code puts you inside the live product on a seeded dealership — every role, read-only, nothing staged for the tour.

Step oneEnter an email, get a demo code back.
Step twoSwitch between roles and read their live boards.
Step threeStart a trial when it makes sense — 30 days for a store.